In economics, one data point by itself does not usually tell a story but when you put together many data points and a trend becomes apparent a great deal of insight can be gleaned from that data.
There were several trends that started to emerge in 2025 that help show where the economy is heading this year. One theme that emerged is that high income earners and large companies are doing much better than low-income earners and small companies. This divergence between these groups has been referred to as the K economy, with one cohort moving higher while the other one moves lower.
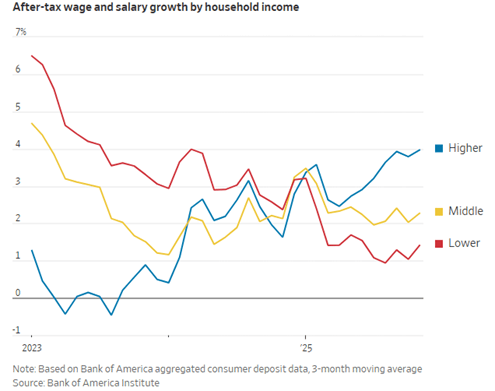
The graph below illustrates the divergence of growth over the past 3 years between high- and low-income earners. Lower income earners saw wage increases during the Covid pandemic but in the past year it was the high-income earners who are experiencing higher pay increases while the low-income earners are receiving much small increases. The difference between the two income groups flows into their spending where lower income earners are struggling to handle consistently higher inflation, especially with real estate and health care expenses. Their financial resources don’t go as far as they did several years ago. While this is occurring, the high-income earners are spending at a higher rate than ever before with increasing wages and expanding net worth statements that are benefiting from an elevated stock market and real estate prices.
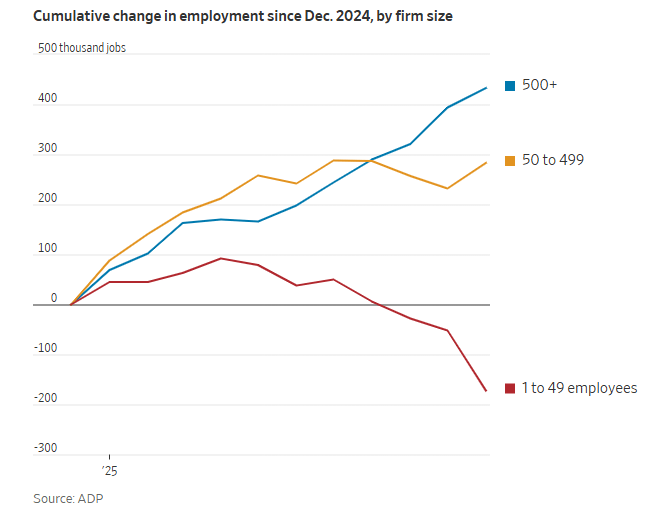
The other trend is the change in employment for smaller companies versus large companies. As shown in the graph below, larger companies continue to add employees, while small companies are starting to shed employees. Larger companies have easier access to cash, they are able to maneuver around tariff issues, and they are less impacted by regional issues. This divergence matters to the success of the economy because small businesses create roughly two thirds of new jobs in the U.S.
Another trend that started to emerge in 2025 is the no-fire, no hire mind set of businesses, especially as it relates to recent college graduates.
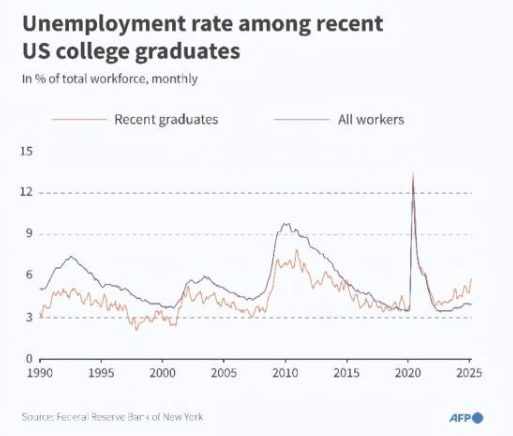
The graph below shows the unemployment rate of recent college grads versus the overall unemployment rates since 1990. In the past 2 years the college graduate unemployment rate is above the unemployment rate for all employees. This is the first time in 35 years that this has happened and it is driven by several factors.
First, with the advent of AI, many entry level jobs that are more administrative in nature, that would have normally been completed by a college graduate are now being completed by AI thus reducing the hiring needs for recent graduates. Secondly, after struggling to find good workers during the pandemic, companies are reluctant to let go of employees so there have been very few large lay offs and companies are tending to keep larger staffs while at the same time they are reluctant to do to much hiring.
These trends would indicate that we’ll probably continue to see an economy where small businesses and lower income households struggle while large businesses and higher income households are in strong positions. The question to be answered is whether small businesses and lower income households can find their footing for a stronger 2026 or does this economic weakness experienced by these groups spread to larger companies and higher income households.