There are many things that are very difficult to forecast in our lives, including the weather, the stock market and the outcome of sporting events. But the one forecast that may take the prize as the most difficult is forecasting interest rate changes by the Federal Reserve. The primary lever the Fed has to control interest rates is the overnight bank lending rate which is called the federal funds rate. When the Fed wants to stimulate the economy, they lower this rate and when they want to slow economic growth they raise the federal funds rate. Both the Federal Reserve and the futures market forecast expected future Federal Funds rate changes for the next 1-3 years.
Below is a graph that shows the actual federal funds rate over the past 25 years (dark blue line) and it also shows the forecasted federal funds rate for a 1-3 year period throughout the past 25 years (purple lines). What is clearly evident in this graph is how wrong the forecast is for the federal funds rate versus the actual changes to the federal funds rate. Two periods that are particularly bad with the forecast is in the 2010s when the market kept expecting the rate to increase over a 7 year period and it remained flat. Another time was in 2021& 2022 when the market was forecasting a very slow increase in rates while in reality the federal reserve rates increased by 500bps in 18 months.
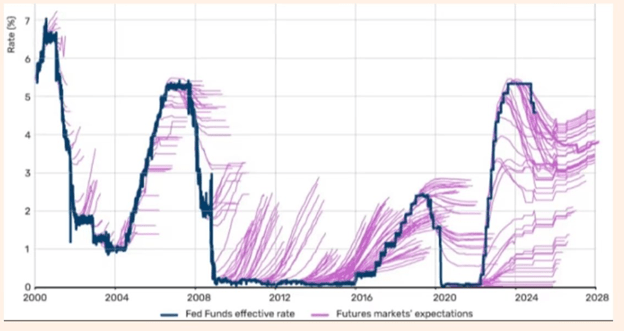
The main take away from this graph is to not put much weight behind these forecast and keep your bond portfolios diversified with both short and long-dated bonds as well as high and low credit rated bonds.